Dashboard
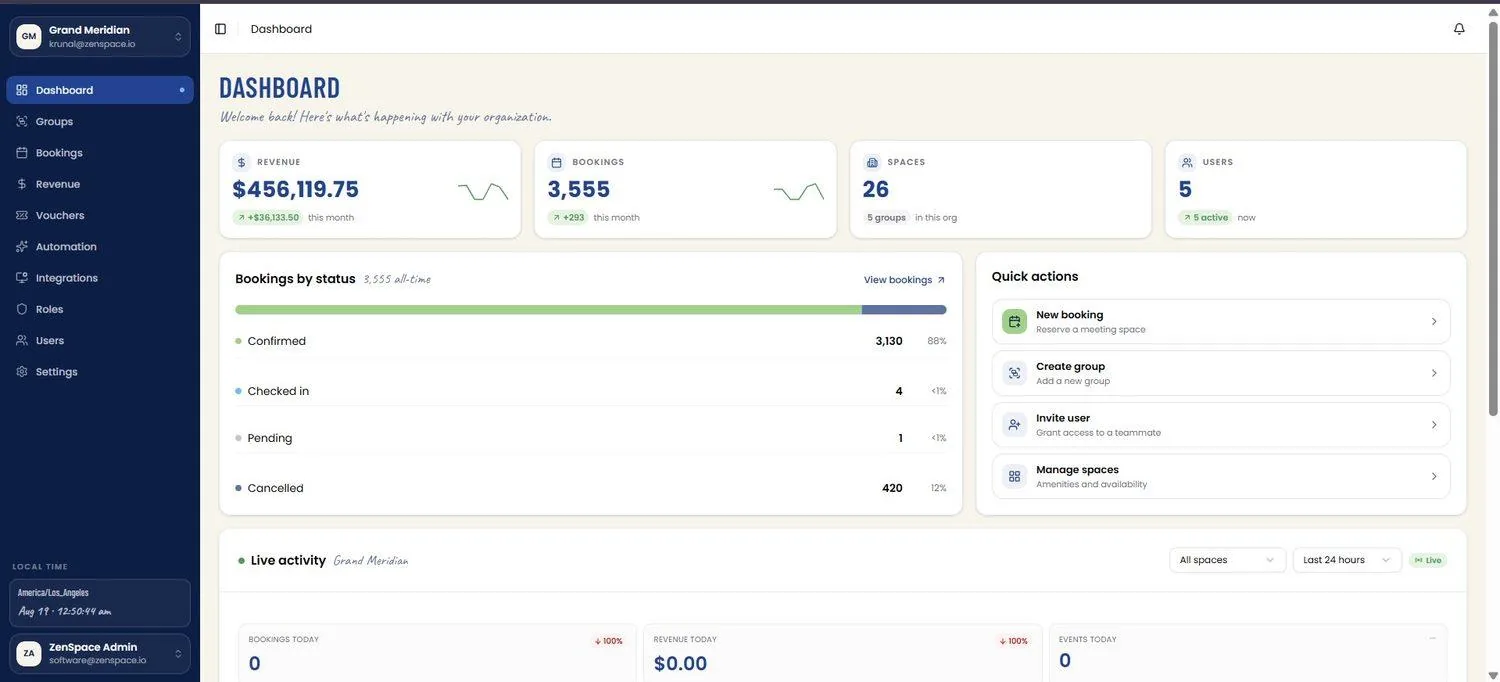
📸 Dashboard Home
Main organization dashboard showing four headline metric cards — Revenue, Bookings, Spaces, and Users — each with a trend delta (e.g., "+$36,133.50 this month", "+293 this month") and a small sparkline. Below, a Bookings by status panel replaces the raw activity list with a proportional bar and a Confirmed/Checked in/Pending/Cancelled breakdown (counts and percentages) plus a View bookings link, alongside Quick Actions (New booking, Create group, Invite user, Manage spaces). Route: /dashboard
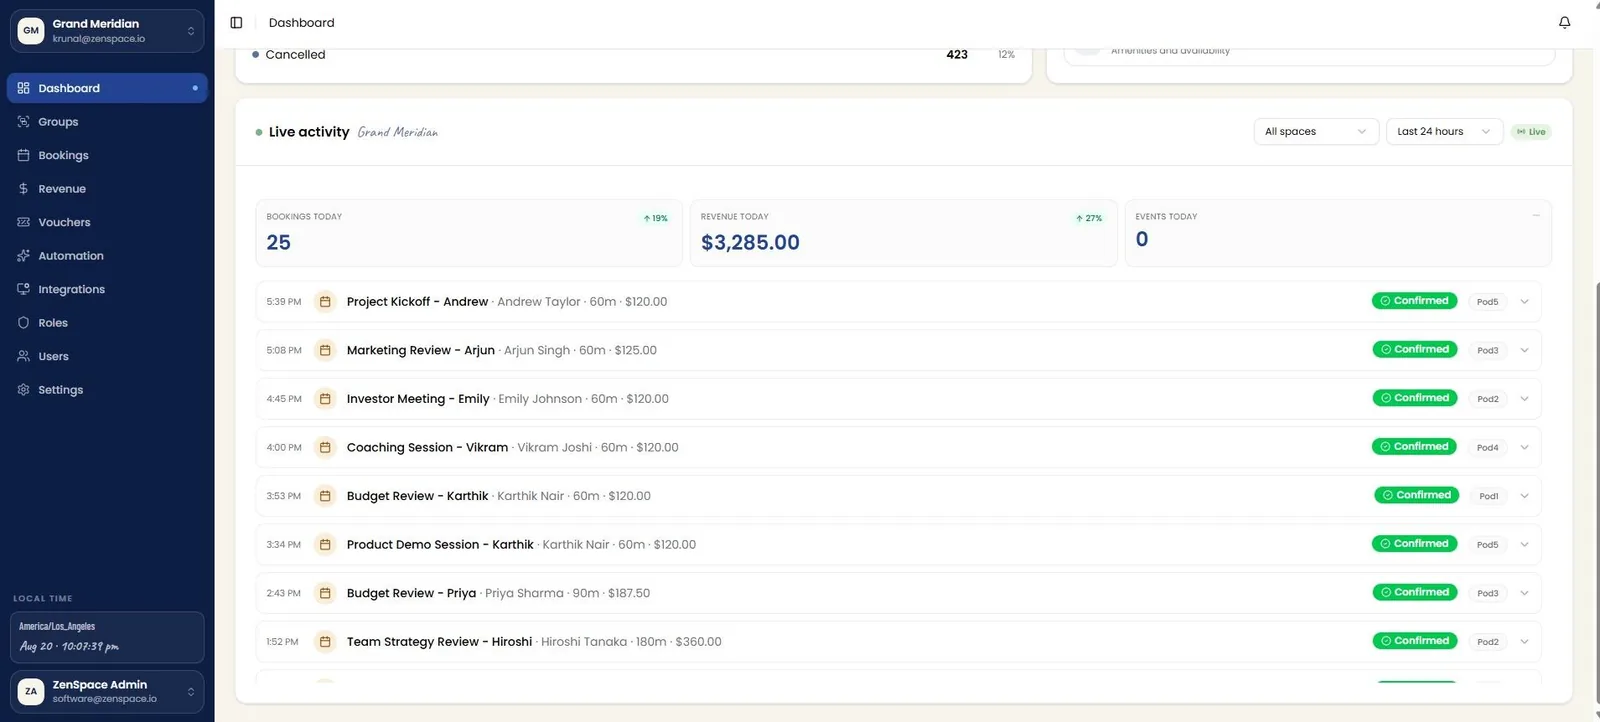
📸 Dashboard — Live Activity Feed
Scrolling down, the dashboard shows a per-organization Live activity panel with space and time-range filters (All spaces / Last 24 hours), day-level tiles for Bookings Today, Revenue Today, and Events Today, and a realtime stream mixing device events (e.g., Pod Door Hub Lock/Unlock, sensor state changes) with booking events (attendee name, duration, price, and status) tagged with the corresponding pod.