Diagnostics and Monitoring
The Event Log
Click Event Log in the left navigation to see everything the adapter has done. The page header reads “Event Log — Device events across all gateways.”
Live indicator and Export
Top right of the page:
- A green ● Live indicator shows the feed is updating in real time as new events arrive
- An Export CSV button downloads the currently filtered view as CSV
Filter pills
A row of pill buttons just below the page header lets you narrow events by category:
- All (default)
- lock — door and reader unlock events
- wifi — WiFi-related events
- webhook — webhook delivery and registration events
- adapter — adapter-level system events (API key changes, configuration updates, OTA events)
Filter by device ID
A search box “Filter by device ID…” lets you narrow events to a single device. Paste an ada- ID (or part of one) to filter.
Event table columns
Common event types
Important notes
- Events are not clickable — there’s no expanded-payload view. The DETAIL column shows everything available about the event.
- Live updates stream in at the top of the table; older events scroll down naturally.
- Filters compose — you can combine a pill (e.g., lock) with a device ID filter.
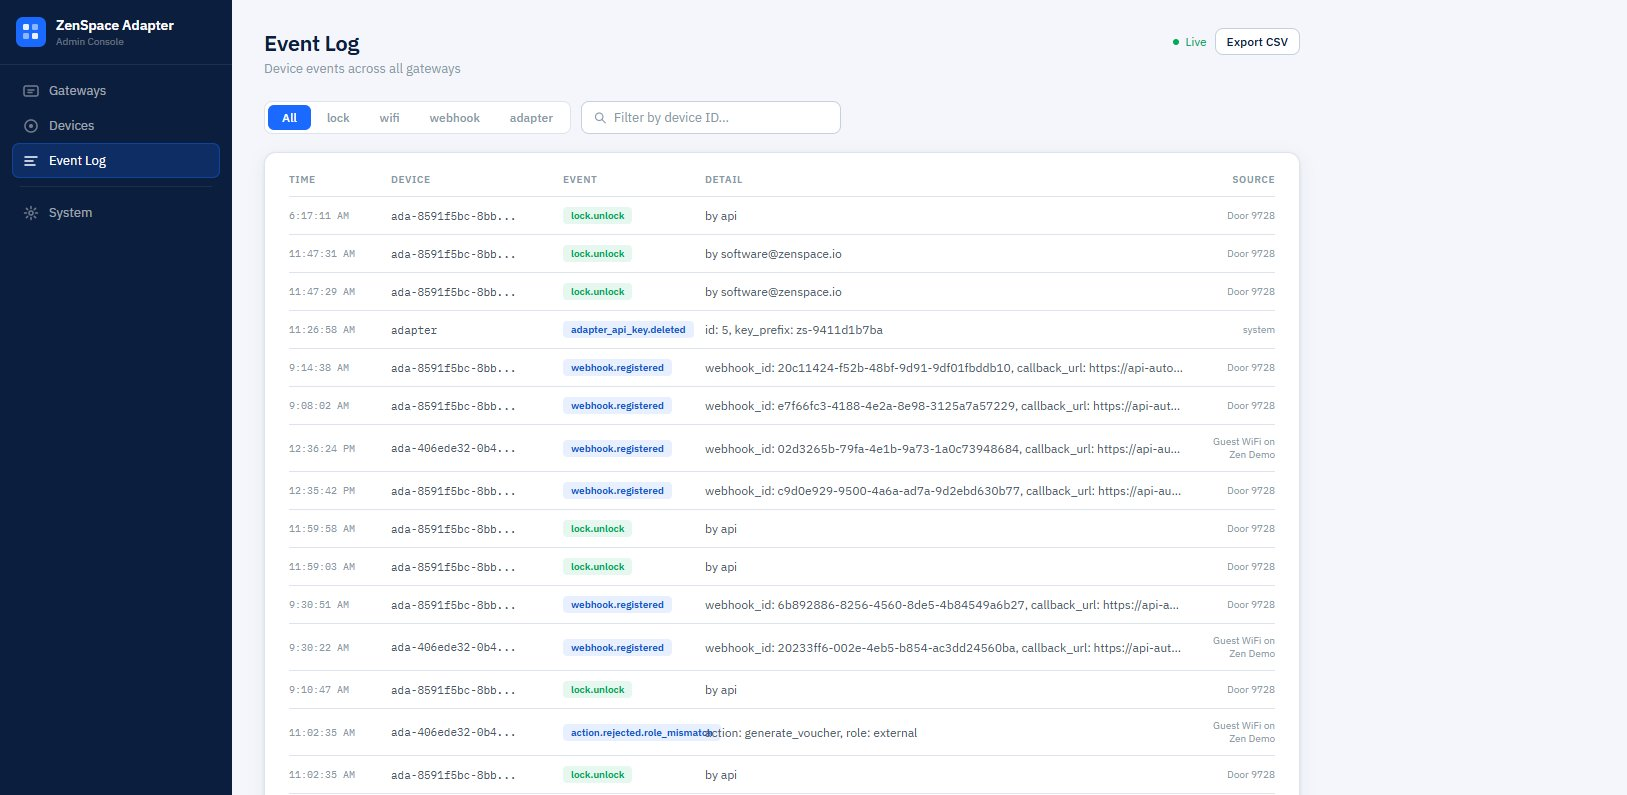
Figure 15 — Event Log: type filter pills, device ID filter, Live indicator, Export CSV, and the events table
Retention
The adapter keeps recent events available for review in the table. Older events are pruned automatically based on storage policy on the Pi.
Hardware Diagnostics
The full diagnostics workflow lives on the System page, not as a separate sidebar entry. See Section 9.4 Hardware Diagnostics for details on running read-only health checks against every enabled device.
The gateway card on the Gateways page also has its own quick diagnostic — see Section 3.5 Run Discovery Diagnostic.
Health Monitoring
The adapter has a built-in health monitor that probes every 2 minutes.
What gets probed
For each gateway, the monitor probes one API source per active source. An API source is “active” if there are onboarded devices using that source.
- Network probe — GET /api/s/
{site}/stat/sysinfo (port 443) - Access probe — GET /api/v1/developer/devices (port 12445)
- Protect probe — GET /proxy/protect/integration/v1/cameras (port 443)
If any probe succeeds, the gateway is online.
Per-API-source cascade
If a specific API source fails 3 times in a row, only the devices on that source go offline. Devices on the other sources stay online. This is important for partial-credential customers — for example, a site with only Access (no Network) sees their doors continue to work even if their Network credentials briefly fail.
When a partial-source failure happens, you’ll see an event like health.gateway_partial_offline in the event log.
Full cascade
When all probes fail, every device on the gateway is marked offline in one cascade write. When any probe later succeeds, the next one restores them.
Status indicators
In device lists and detail pages:
- Green dot — last probe within the last 4 minutes succeeded
- Yellow dot — between 4 and 10 minutes since last success
- Red dot — over 10 minutes, or 3+ consecutive failures
- Grey dot — never probed yet